Background
The third publication of Absa Africa Financial Markets Index (formerly Barclays Group Africa Financial Markets Index) has been released and it is worthwhile reviewing how Ghana’s financial market has fared since the index was first published in 2017. The Absa Africa Financial Markets Index presents an essential tool kit for evaluating the development of African financial markets. The index has tracked the annual progress made in each of these financial markets since its inception. Most importantly, the index presents reliable indicators which can be improved upon by the respective economies for sustainable growth and investor market accessibility benchmarks[1].
The index uses both quantitative and qualitative analysis to rank the selected financial markets via six selected pillars: market depth, access to foreign exchange, tax and regulatory environment, capacity of local investors, macroeconomic opportunities and enforceability of financial contracts. These six pillars are equally weighted to score each financial market. More so, the pillars have underlying indicators which are also equally weighted to score each pillar[2]. For instance, Pillar 1 scores the market depth of each financial centre by analysing the the financial assets available in the market, the size of the total sovereign and corporate bonds market, market liquidity, secondary market makers, size of the repo market amongst others.
Table 1. Country Financial Market Rankings from 2017 t0 2019
| Country | 2017 | 2018 | 2019 |
| South Africa | 1 | 1 | 1 |
| Mauritius | 2 | 4 | 2 |
| Kenya | 5 | 3 | 3 |
| Namibia | 4 | 6 | 4 |
| Botswana | 3 | 2 | 5 |
| Nigeria | 6 | 5 | 6 |
| Tanzania | 11 | 15 | 7 |
| Zambia | 9 | 8 | 8 |
| Rwanda | 8 | 11 | 9 |
| Uganda | 10 | 10 | 10 |
| Egypt | 14 | 16 | 11 |
| Morocco | 12 | 9 | 12 |
| Ghana | 7 | 7 | 13 |
| Seychelles | 16 | 12 | 14 |
| Mozambique | 15 | 18 | 15 |
| Ivory Coast | 13 | 13 | 16 |
| Angola | – | 19 | 17 |
| Senegal | – | 14 | 18 |
| Cameroon | – | 17 | 19 |
| Ethiopia | 17 | 20 | 20 |
Source: Absa Africa Group Financial Market Index 2017, 2018 and 2019 reports.
The Market Rises in the East
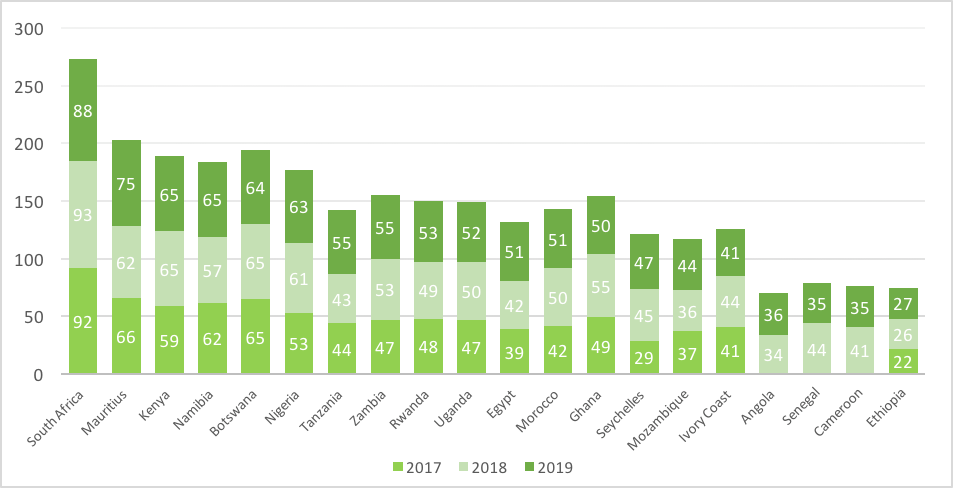
With seventeen (17) countries appearing in the inaugural index, three other countries were added to the subsequent editions (see Table 1). South Africa, the continent’s most developed economy has commanded the top spot over the three years of the index’s publication. Mauritius, Namibia, Botswana and Kenya consistently make up the top five financial markets. Nigeria, Africa’s biggest economy ranks ahead of the West African contingent of Ghana, Ivory Coast and Senegal. Whilst the East African markets largely maintained or improved on their rankings, their West African counterparts dropped places in the latest rankings. Noticeably, Ghana dropped six (6) places from being in the top ten to the thirteenth place. Irrespective of the observed drops in ranking, the report shows that individual economies fared well in terms of their overall scores across the six (6) pillars over the three-year period (see Figure 1). The average overall score shot up from 49.6% in2017 to 52.7% in 2019[3].
Figure 1. Overall country scores from 2017 to 2019
Source: Absa Africa Group Financial Market Index 2017, 2018 and 2019 reports.
Scorecard Review
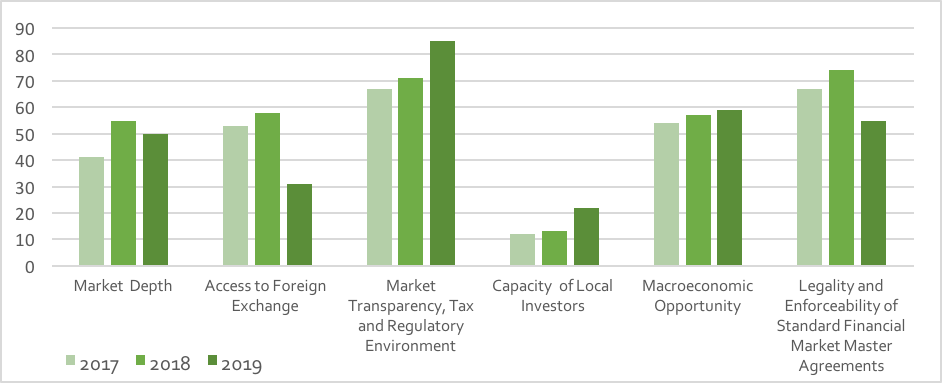
Ghana’s financial market scored above average in two consecutive years during the period under review (see Figure 1). Similarly, a review of the individual metrics showed that Ghana scored well across all metrics with the exception of local investor capacity (see Figure 2). Ghana’s financial market consistently improved its score and ranking in the tax and regulatory environment for three successive years. The adoption of international accounting conventions such as International Financial Reporting Standards (IFRS) and quality human capital to engage the business of implementation of same and subsequent auditing of these processes has contributed immensely to this recognition. The bold move by regulators to phase in Basel II and some aspects of Basel III capital framework in bank capital adequacy requirement has equally contributed to these higher scores. Further to developing financial markets is the element of taxation. The tax regime in the jurisdiction such as the existing tax holidays for mutual funds, real estate investment trusts and the non taxation of capital gains are largely considered as favourable for financial market development.
Ghana’s financial market also obtained higher scores in legality and enforceability of financial contracts entered into by parties within its jurisdiction. A score of 67% in the maiden edition was improved upon to 74% in the subsequent ranking. However, a decline to 55% in the 2019 ranking reflects identified weaknesses identified in this pillar with respect to the market. The use of financial market master agreements, netting and collateral positions and insolvency frameworks are the three parameters that make up the scoring of this pillar. The use of master agreements developed by the International Swaps and Derivatives Association (ISDA) is well recognized in Ghana’s financial market. However, unlike the ISDA, Global Master Repurchase Agreement (GMRA) and Global Master Securities Lending Agreement (GMSLA) are in limited use and not in use respectively. The non adoption of GMSLA affected the scoring of this pillar adversely. Ghana’s insolvency framework which was the weakest in 2017 of all the index countries continued to plague it. Despite the existence of an insolvency law, the report indicates that there is much work to be done given the higher creditor recovery cost.
Figure 2. Ghana’s scorecard across the six pillars from 2017 to 2019
Source: Absa Africa Group Financial Market Index 2017, 2018 and 2019 reports.
Table 3. Ghana’s ranking for each pillar from 2017 to 2019
| Financial Market Index Pillars | 2017 | 2018 | 2019 |
| Market Depth | 10 | 4 | 7 |
| Access to Foreign Exchange | 9 | 10 | 17 |
| Market Transparency, Tax and Regulatory Environment | 8 | 6 | 5 |
| Capacity of Local Investors | 15 | 18 | 9 |
| Macroeconomic Opportunity | 13 | 14 | 11 |
| Legality and Enforceability of Standard Financial Market Master Agreements | 7 | 6 | 10 |
| Total number of Indexed Economies | 17 | 20 | 20 |
Source: Absa Africa Group Financial Market Index 2017, 2018 and 2019 reports.
The Macroeconomic opportunity pillar saw incremental changes over the three-year period (see Figure 2). These scores were above the average of 50% and were measured in the three (3) key areas of economic performance GDP growth and export competitiveness), financial risks (debt profile and health of banking sector) and macro transparency (transparency in monetary and fiscal policy communications). Ghana has experienced significant economic growth over the review period. With GDP growth of 3.7% prior to the maiden edition of the index, this has more than doubled and augers well for the country’s scoring. Favourable trade conditions for its main exports has contributed to the robustness of its export market. These have been good signals in terms of growth prospects for the market development. The debt profile of the country which had been mounting during the review period and the weakening of the banking sector (insufficient capital to absorb unexpected losses) negatively impacted the scoring. As noted by the report in 2017, Ghana recorded the highest Non-Performing Loan (NPL) ratio amongst the indexed countries. The banking sector continued to experience higher NPLs in the subsequent years. Higher NPLs make banks risk averse which in turn prices out smaller enterprises from banking funding. The modus operandi of the Monetary Policy Committee of the Central Bank in communicating its decisions after each sitting as well as the Public Financial Management Act,2016 (Act 921) to guard the the management of the public purse are positives to Ghana’s financial market scoring above average in this pillar.
While access to foreign exchange improved from a score of 53% in 2017 to 58% in 2018 respectively, there was a significant decline to 38% in 2019 (see Figure 2). Ghana’s ranking deteriorated from nine to seventeen in the latest edition (see Table 3). This pillar measures the liquidity of foreign exchange within the index market, the presence or absence of capital controls and the ease of access to of foreign exchange data. Foreign exchange liquidity as gauged by foreign exchange trades in the interbank bank market jumped significantly from $18bn in 2017 to $29bn in 2018. However, there was significant impairment of foreign exchange liquidity in 2019 when the authors of the report adjusted for the Central Bank of Ghana’s transactions in the interbank market. It is worth noting that the Central Bank is the recipient of the yearly cocoa syndicated loans and proceeds of Eurobonds which eventually gets channeled into the interbank market. Persisting multiple exchange rates as observed at forex bureaus, banks and the black market as well as vulnerabilities to capital outflows (due to lower foreign exchange reserves) have consistently been discounted in scoring this pillar.
The financial market depth scored below 50% in 2017 but subsequently improved upon that. With much lower trading volumes, equity turnover was about 1% of market capitalization giving it a lower liquidity score. A similar pattern was observed for bond trading where investors usually hold the instrument to maturity which explains the lower levels of market activity. Nonetheless, the pillar ranked favourably amongst the indexed markets especially in 2018 when market capitalization increased to 118% of GDP and bond trading experienced increased market activity (turnover was 53%). The existence of primary market dealers of government securities who act as market makers and subsequently sell these securities to their clients is fundamental to the functioning of the financial market and contributes to the good scoring. Other financial market initiatives such as the introduction of the Ghana Alternative Market to list small and medium size companies and the Ghana Commodity Exchange for the trading of soft commodities were recognized as market depth enhancing.
Local investor (pension funds and insurance companies) capacity ranking improved considerably over the period from 15 in 2017 to 9 in 2019. Irrespective of the rankings, scores for the three consecutive years were well below the average score of 50%. It also stands out as the worst scoring financial index pillar. Per capita assets under management and assets under management as a ratio of the value of domestic financial market assets characterized this pillar. Although regulatory reforms have helped boost the asset base of Ghanaian pension funds over the last decade, the AUM of both pension funds and insurance companies have significantly and consistently been lower than the index average. Per capita assets under management has been below $100 over the three-year period. Ghana continued to score lower points since its capital markets are not deep and liquid enough thereby limiting the investment options of local investors.
“Absa Barometer”
The “Absa Barometer” comes at a time when national economies face divergent prospects. The body of work reflects the output of financial market policy formulations and implementation across national boundaries. The barometer remains an important guide to be used by policy-makers and financial market participants in building the continent’s fragmented financial market infrastructure. In the hands of the investor the “Absa Barometer” is a tool to navigate the continent’s financial market terrain.
A well accepted tax system, regulatory reforms and the enforceability of financial contracts strengthened Ghana’s financial market over the review period. However, a weaker insolvency framework, low capacity of local investors and foreign exchange illiquidity equally weighed it down. It may be important to critique[4]the methodologies employed in generating the numbers behind the scores and rankings, however, the bigger picture should not be lost on us.
[1]Barclays Africa Group Financial Market Index 2017
[2]Absa Africa Financial Market Index 2018
[3]Absa Africa Financial Market Index 2019
[4]https://www.myjoyonline.com/business/2019/October-20th/ghana-drops-6-placesin-2019-absa-financial-market-index.php

Leave a comment